 |
Result window (graphic)
 |
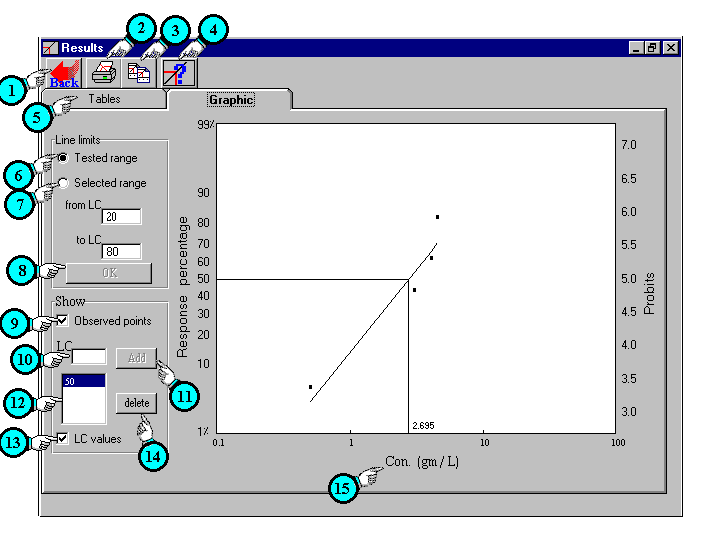
Description of
Results window (graphic) contents.
| 1 | Back button: | Allow you back to main window to edit or modify your data. |
| 2 | Print button: | Display print dialog box |
| 3 | Copy button: | This button allow you to copy tables when tables are exhibited and copy graphic when graphic is exhibited. |
| 4 | Help button: |
Display related help |
| 5 | Tables: | Display Tables sheet |
| 6 | Tested range option: | That mean the line is limited by upper and lower doses. |
| 7 | Selected range option: | This option allows you to set the line limits between the values below. |
| 8 | OK button: | Accept and extend the line between the two values above. |
| 9 | Observed point: |
Appear the actual tested points on the graph. |
| 10 11 12 |
Show the incidences: | To show the incidences of any LD on X & Y axis. First write certain LD or LC in field (no. 10) then click on add button (no. 11). That will add certain value to list no. 12 and draw incidences. As illustrated above by LC50. |
| 13 | Show LD value: | Show certain LD value near vertical incidence. In the above example the LD50 was 2.695 |
| 14 | Delete button: | Delete selected LD from LDs list (no. 12) and remove its drop lines. |
| 15 | Footer field: | If you need to edit this field just click on it, that will allow you to edit it. |