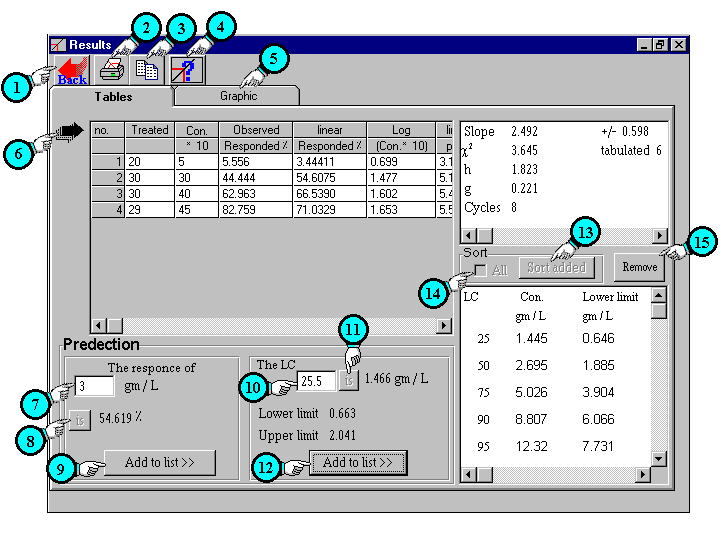
Result window (tables)
Description of
Results window (tables) contents.
| 1 | Back button: | Back to main window to edit or modify your data. |
| 2 | Print button: | Display print dialog box |
| 3 | Copy button: | This button allow you to copy tables when tables are exhibited and copy graphic when graphic is exhibited. |
| 4 | Help button: |
Display related help |
| 5 | Graphic: | Display graphic sheet |
| 6 | Auto resize column width: | Auto resize column width according to text width. If you have manually changed column width clicking on this arrow will automatically resize it again. |
| 7 & 8 | Predict the response of any dose, con. ext... | To predict the response of
any stimulus value (dose, concentration or time ext...),
fill field no. 7 with certain stimulus value then click
button no. 8. In the above example we predict the response of 3 gm/L, which was 54.619%. |
| 9 | Add to list: | To add this prediction to LCs list which tabulated on the right. In the case of above example it will be added like LC 54.619 is 3 gm/L. |
| 10 & 11 | Predict the dose, which reveal certain response: |
To predict any LD or LC (between
LD0.1 to LD99.9) , fill field no.
10 with certain value (X) then click button no. 11 to
predict LDx. In the above example we predict the LC 25.5 which was 1.466 gm/L. |
| 12 | Add to list: | To add this prediction to LCs list which tabulated on the right. In the case of above example it will be added like LC 25.5 is 1.466 gm/L. |
| 13 & 14 | Sort LDs list: | After adding one or more LD
to LDs list you may need to sort the list. Check box no. 14 allow you to sort all LDs (original and added) in one order when checked, but if it is not checked that will sort only added LDs after original LDs. Click on button no. 13 to sort them. (original LDs that LDs which auto-calculated by LdP Line and previously exist in the list, while added LDs that LDs which you have added to the list by buttons no. 9 & 12). |
| 15 | Remove button: | Delete selected row (LD) from LDs list. |